Your textile diversion, fully visible
Every collection is weighed, sorted by fiber, and logged. The LoopFiber dashboard gives you real-time data on diversion rates, GHG impact, fiber composition, and contamination — so you can make decisions with full transparency.
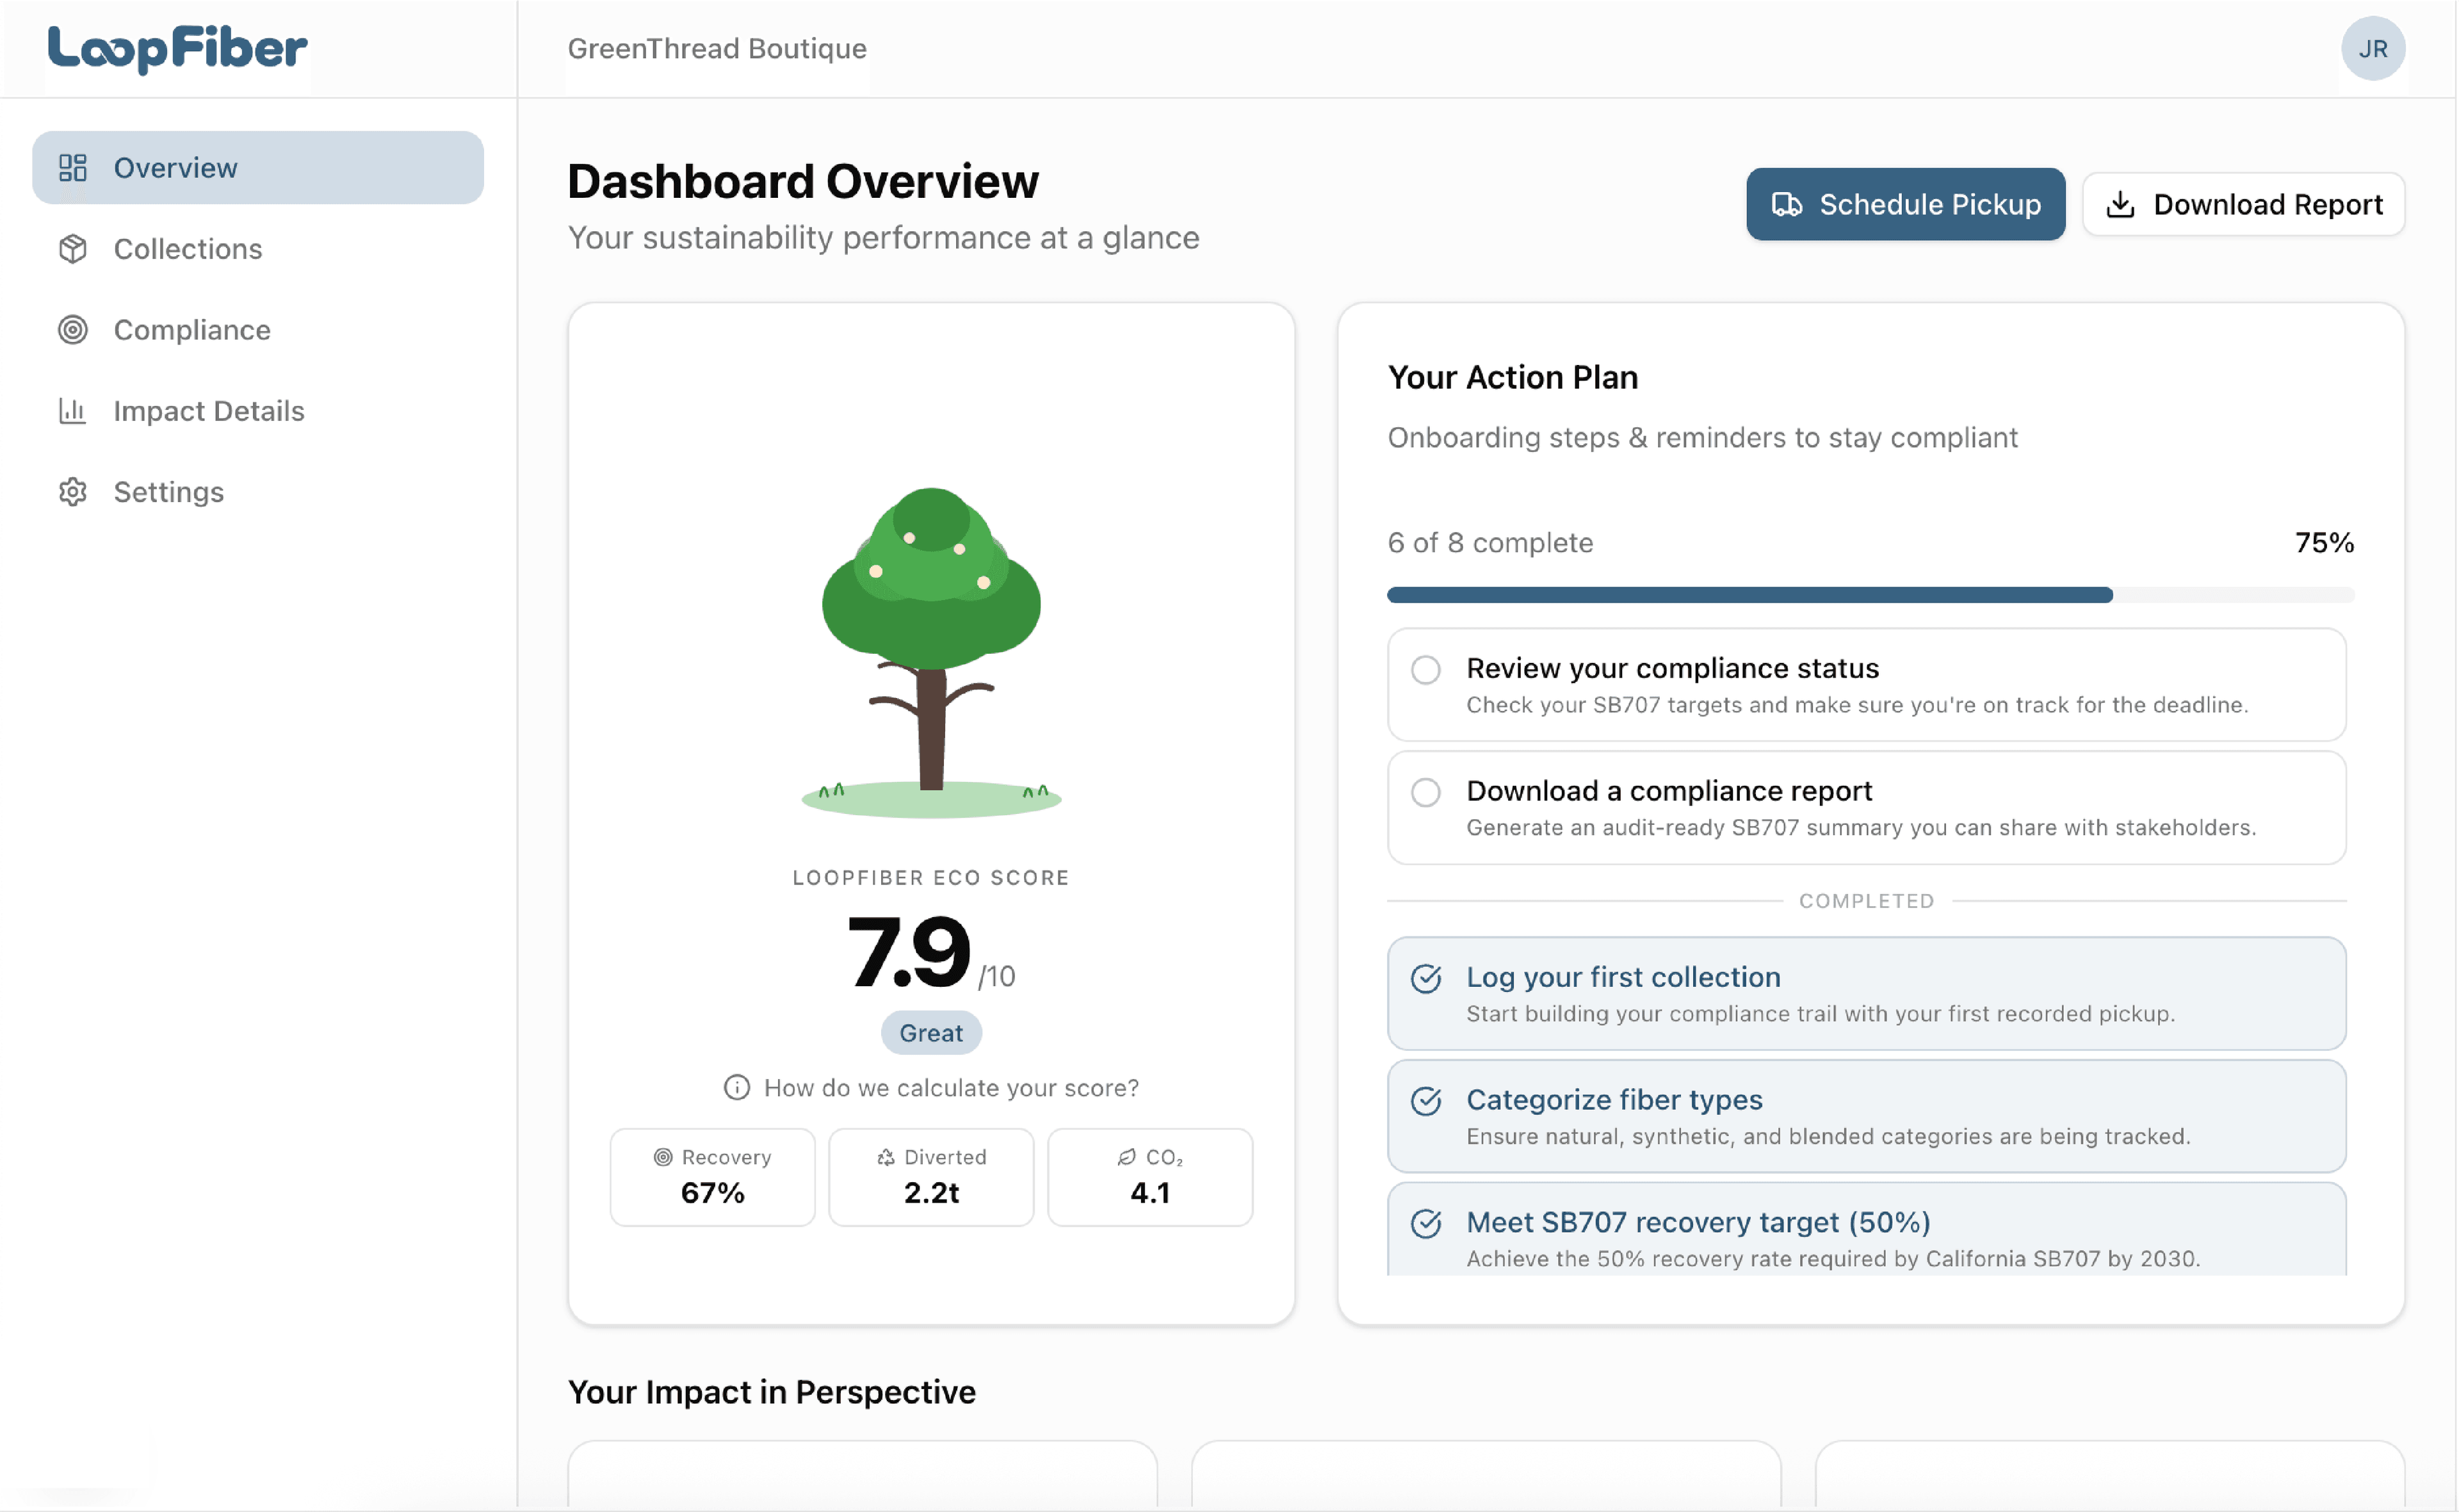
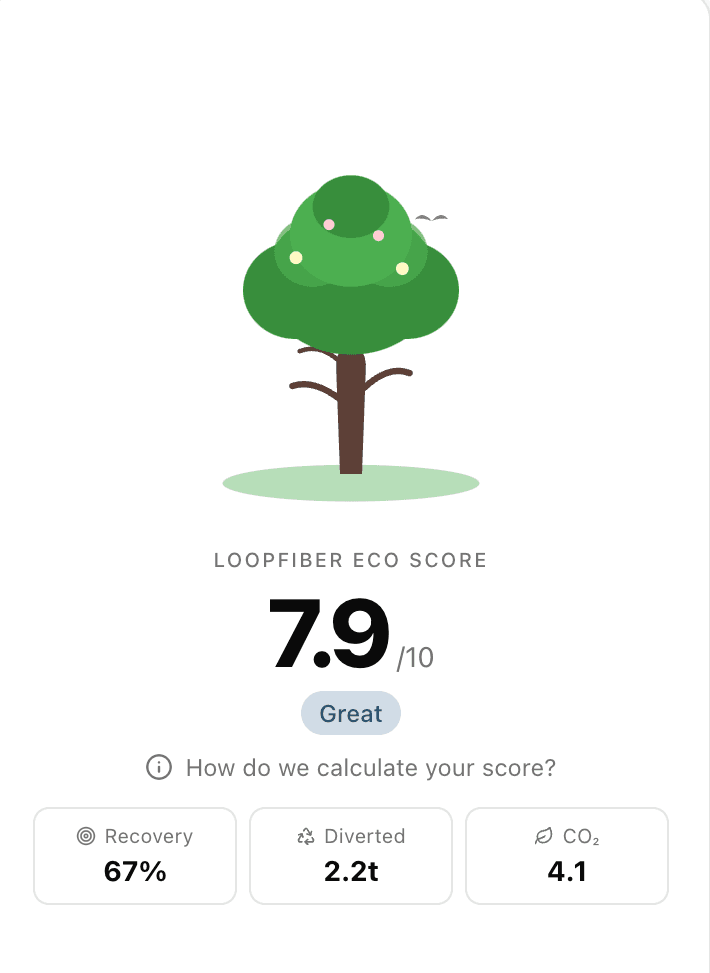
One number that tells the whole story
Sustainability data can be overwhelming — recovery rates, contamination levels, diversion methods, collection volume. Most business owners don't have time to parse spreadsheets. The LoopFiber Eco Score distills everything into a single 1–10 rating so you know at a glance how you're doing.
It's designed for the business owner who needs a quick answer: Am I on track? A 7+ means you're doing great. Below 5, there's room to improve. The score updates with every collection so progress is always visible.
The single biggest factor. How much of your total collected material is being recovered vs. landfilled — the clearest measure of your circular impact.
Lower is better. Contaminated material — mold, chemical residue, non-textile waste — can't be recycled. Cleaner streams mean a higher score.
The more natural fibers we can collect and recycle, the closer we get to a truly circular economy. This metric rewards streams rich in recyclable natural materials over synthetics.
Consistent participation matters. Regular collections show commitment and build a reliable data trail — the baseline is designed for small businesses.
Everything you need to track your impact
Built for businesses generating textile waste — from hospitality and fashion to laundries and uniform suppliers.
Full Transparency
Every pickup is documented. Every pound is weighed, sorted, and logged. Your dashboard shows exactly where your textiles go.
Fiber Breakdown
See what's in your waste stream — natural, synthetic, and blended — broken down by material, weight, and percentage.
GHG Impact
Quantified carbon savings based on EPA WARM v16 emission factors. See your CO₂e avoided in trees planted, cars off the road, and homes powered.
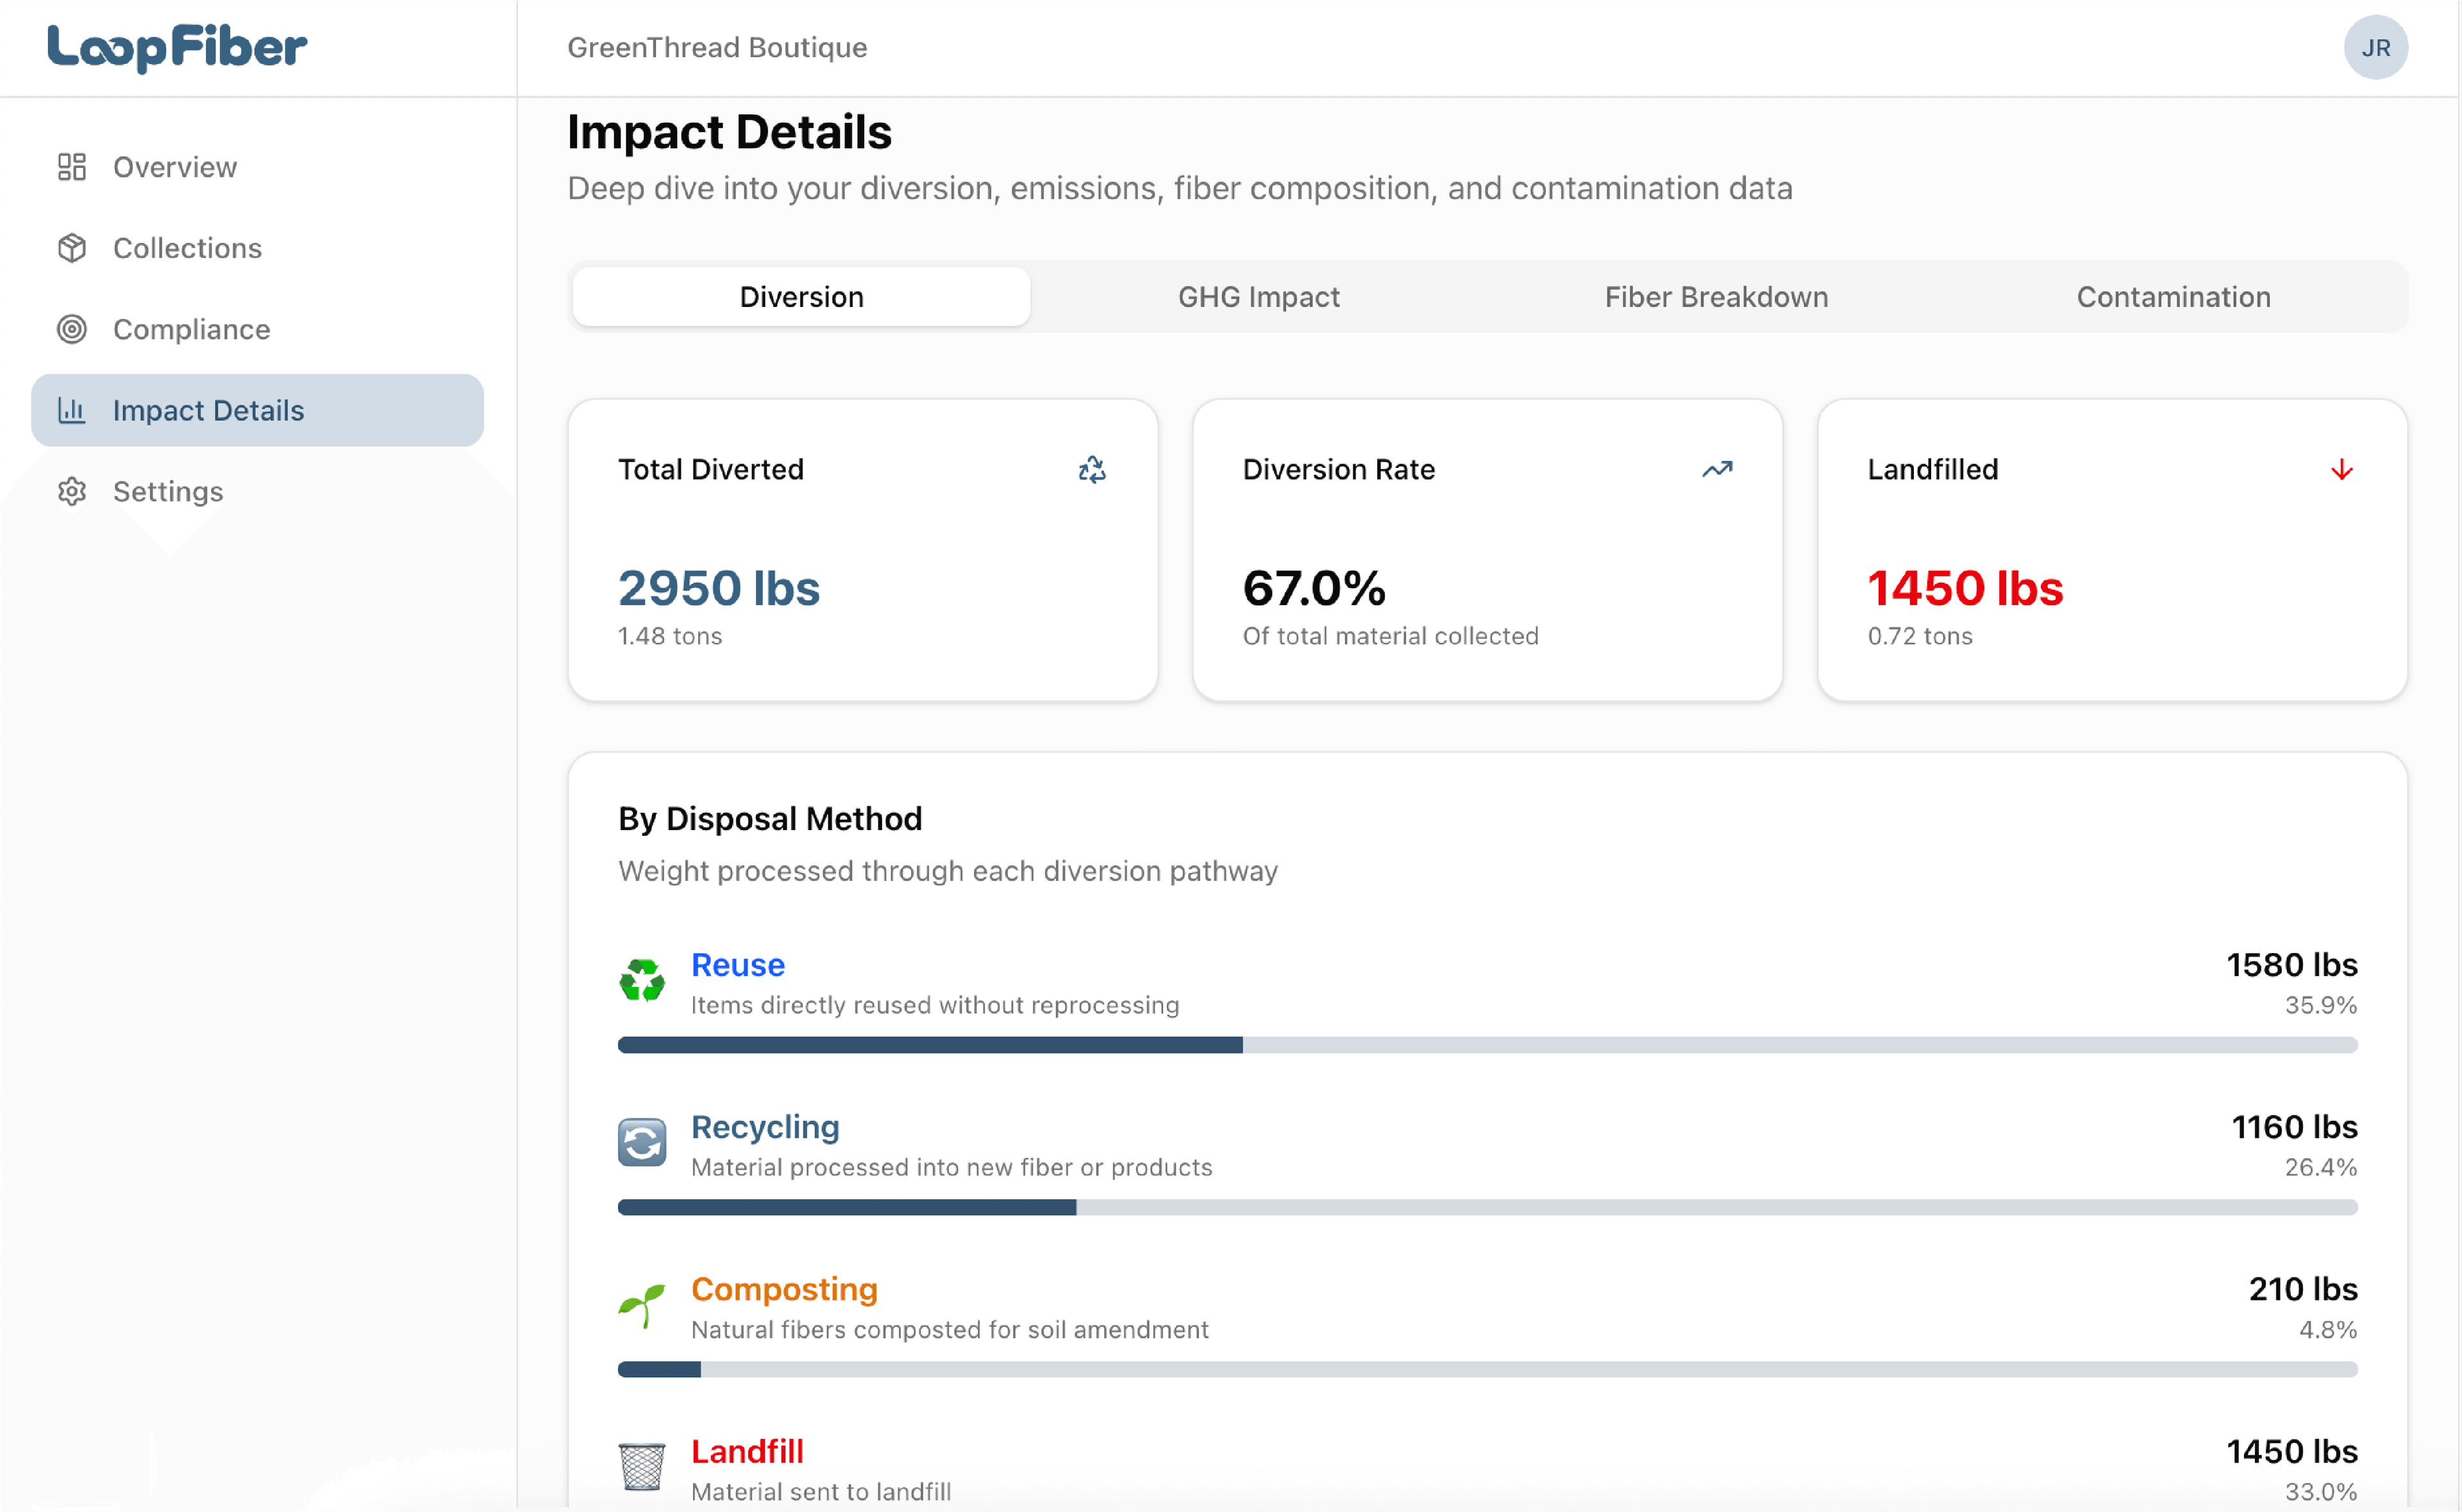
Diversion Tracking
See total weight diverted, diversion rate, and a breakdown by disposal method — reuse, recycling, composting, and landfill.
Eco Score
A single 1–10 score that reflects your overall sustainability performance — recovery rate, diversion, and CO₂ impact combined.
A deeper look at your data
From carbon impact to fiber composition — explore the dashboards that give you full visibility into your textile diversion.
Quantified Carbon Savings
See your total CO₂e avoided — calculated using EPA WARM v16 emission factors. We translate the numbers into equivalents that matter: cars off the road, tree seedlings grown, and homes powered.
Stay in the Loop
Sign up for updates on our progress, partnerships, and the future of circular textiles in the Bay Area.